import geoquetzal as gq

deptos = gq.departamentos()
ax = deptos.plot(color="lightyellow", edgecolor="gray", figsize=(8, 8))
gq.lagos().plot(ax=ax, color="lightblue", edgecolor="steelblue")
ax.set_axis_off()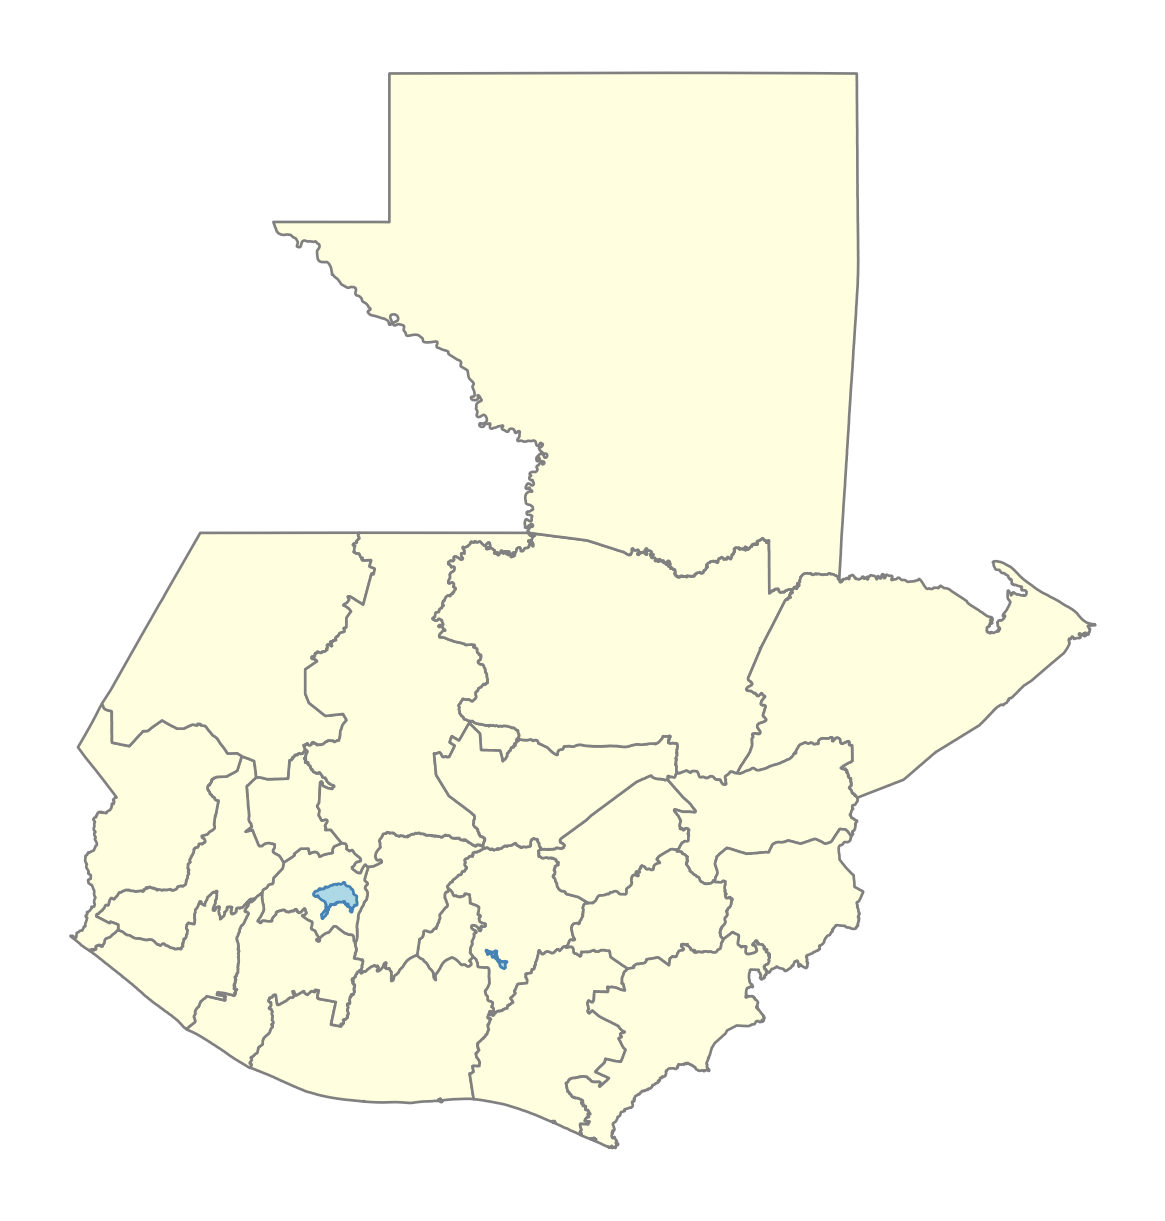
This section shows how to visualize Guatemala’s administrative boundaries. To combine maps with census data, see Census + Maps.
import geoquetzal as gq
deptos = gq.departamentos()
ax = deptos.plot(color="lightyellow", edgecolor="gray", figsize=(8, 8))
gq.lagos().plot(ax=ax, color="lightblue", edgecolor="steelblue")
ax.set_axis_off()
library(geoquetzal)
library(ggplot2)

ggplot() +
  geom_sf(data = departamentos(), fill = "lightyellow", color = "gray") +
  geom_sf(data = lagos(), fill = "lightblue", color = "steelblue") +
theme_void()import geoquetzal as gq
munis = gq.municipios()
ax = munis.plot(color="lightyellow", edgecolor="gray", linewidth=0.4, figsize=(8, 8))
gq.lagos().plot(ax=ax, color="lightblue", edgecolor="steelblue")
ax.set_axis_off()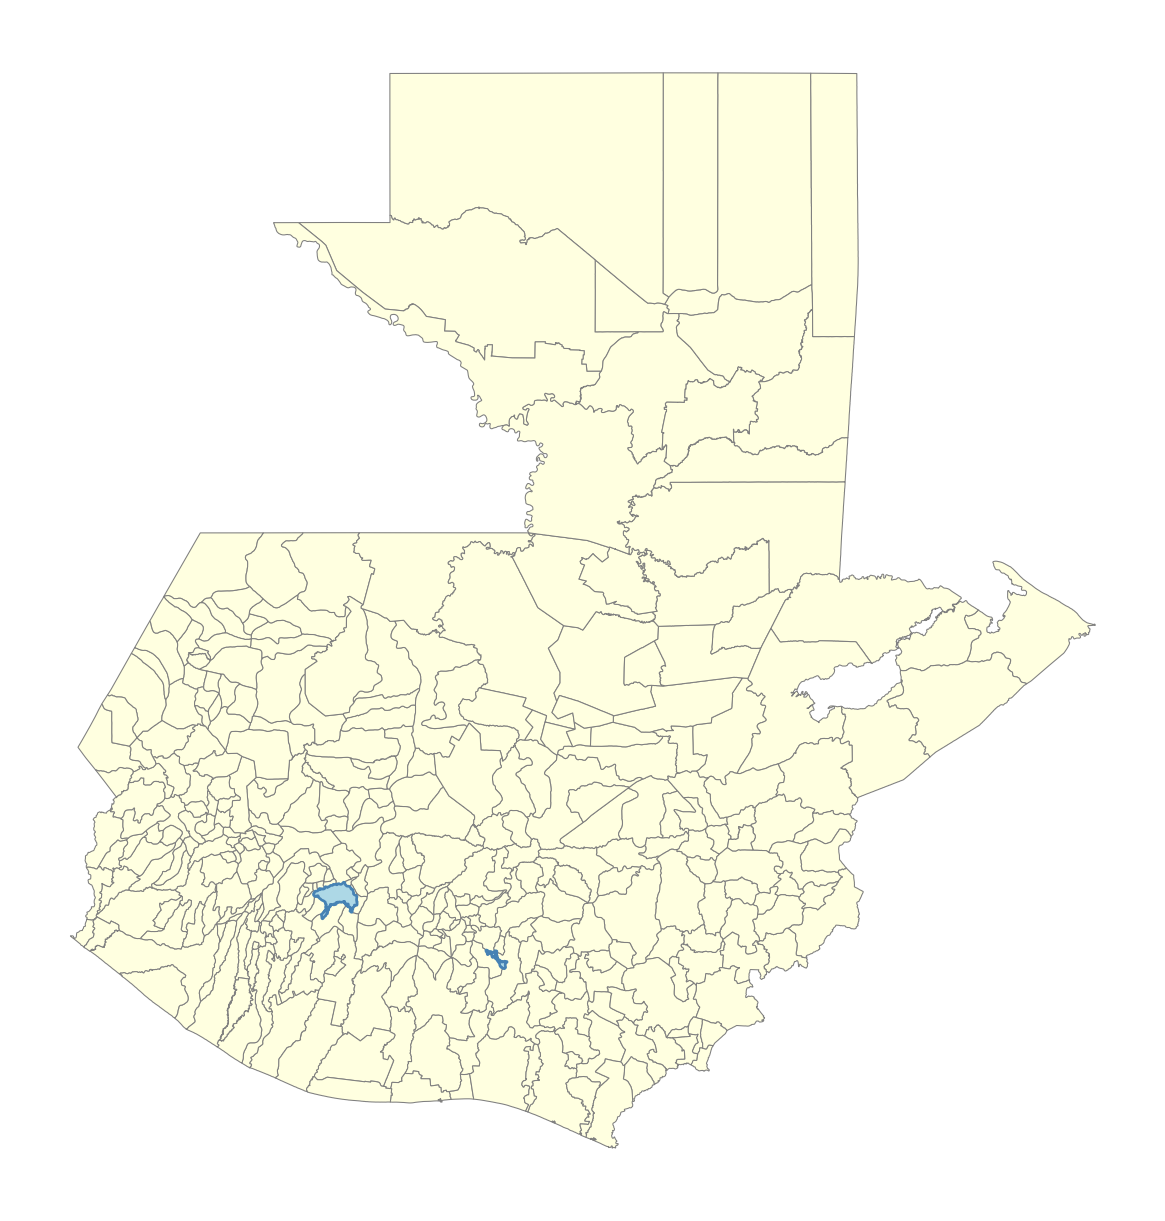
library(geoquetzal)
library(ggplot2)

ggplot() +
  geom_sf(data = municipios(), fill = "lightyellow", color = "gray", linewidth = 0.4) +
  geom_sf(data = lagos(), fill = "lightblue", color = "steelblue") +
theme_void()import geoquetzal as gq
munis = gq.municipios("Sacatepequez")
ax = munis.plot(color="green", edgecolor="white", figsize=(8, 8))
ax.set_title("Municipios de Sacatepéquez", fontsize=14)
ax.set_axis_off()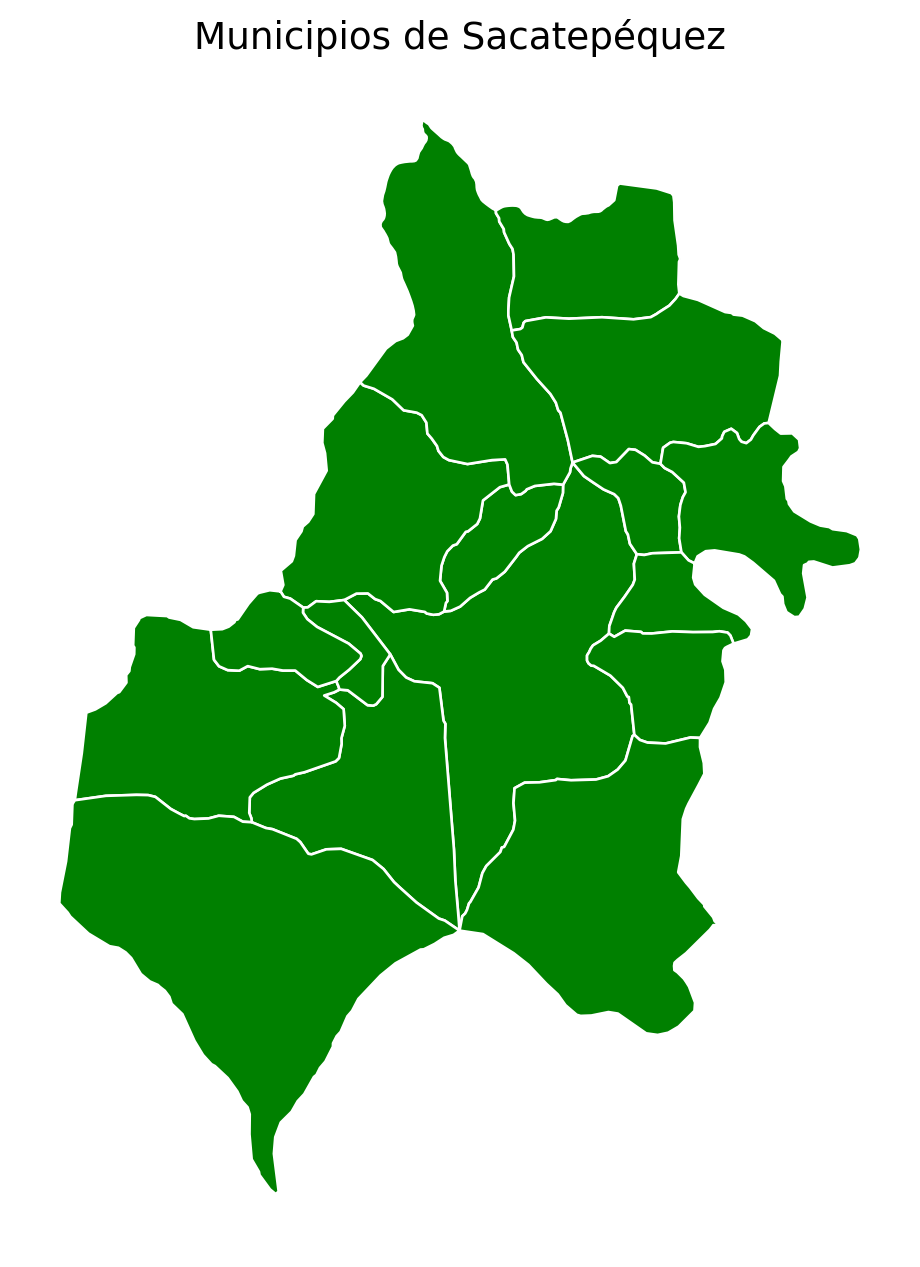
library(geoquetzal)
library(ggplot2)

ggplot() +
  geom_sf(data = municipios("Sacatepequez"), fill = "green", color = "white") +
  ggtitle("Municipios de Sacatepéquez") +
theme_void()import geoquetzal as gq
munis = gq.municipios("Sacatepequez")
munis.explore(
tooltip=["municipio", "codigo_muni"],
tooltip_kwds={"aliases": ["Municipality", "INE Code"]},
tiles="CartoDB positron",
style_kwds={"weight": 1, "color": "green", "fillOpacity": 0.3},
)library(geoquetzal)
library(mapview)
mapview(
municipios("Sacatepequez"),
map.types = "CartoDB.Positron",
color = "green",
alpha.regions = 0.3,
lwd = 1,
label = "municipio"
)import geoquetzal as gq
zonas = gq.municipios("Guatemala", zonas=True)
zonas.explore(
tooltip=["zona"],
tooltip_kwds={"aliases": ["Zone"]},
tiles="CartoDB positron",
style_kwds={"weight": 1, "color": "steelblue", "fillOpacity": 0.3},
)The zonas=TRUE parameter is not available in the R package. Standard Guatemala City municipalities are shown instead.
library(geoquetzal)
library(mapview)

mapview(
  municipios("Guatemala"),
  map.types     = "CartoDB.Positron",
  color         = "steelblue",
  alpha.regions = 0.3,
  lwd           = 1,
  label         = "municipio"
)Lugares poblados have centroid coordinates for point visualization.
import geoquetzal as gq

# Load with point geometry
gdf = gq.lugares_poblados(departamento="Sacatepequez", geometry=True)

# Overlay on municipality boundaries
ax = gq.municipios("Sacatepequez").plot(
    color="lightyellow", edgecolor="gray", figsize=(8, 8)
)
gdf.plot(ax=ax, color="steelblue", markersize=5, alpha=0.7)
ax.set_title("Lugares Poblados — Sacatepéquez", fontsize=14)
ax.set_axis_off()
ℹ 22 lugares poblados excluidos por coordenadas nulas (códigos terminados en 999 — asentamientos sin nombre oficial).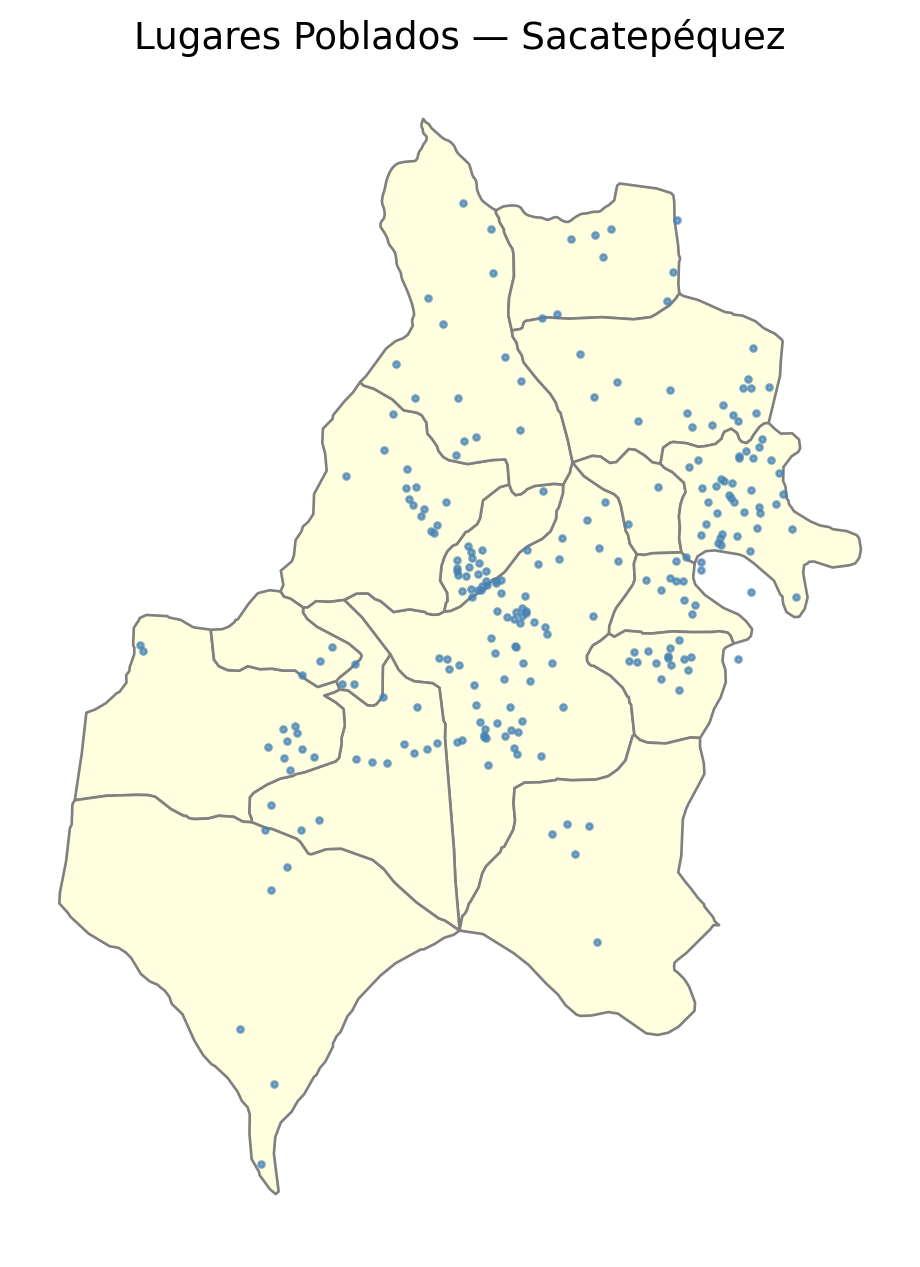
library(geoquetzal)
library(sf)
library(ggplot2)

# Load and convert to sf points (centroids)
lp <- lugares_poblados(departamento = "Sacatepequez")
lp_valid <- lp[!is.na(lp$longitud) & !is.na(lp$lat), ]
lp_sf <- sf::st_as_sf(lp_valid, coords = c("longitud", "lat"), crs = 4326)

# Overlay on municipality boundaries
ggplot() +
  geom_sf(data = municipios("Sacatepequez"), fill = "lightyellow", color = "gray") +
  geom_sf(data = lp_sf, color = "steelblue", size = 1, alpha = 0.7) +
  ggtitle("Lugares Poblados — Sacatepéquez") +
theme_void()Since INE does not publish official lugar poblado boundaries, GeoQuetzal generates Voronoi tessellation approximations clipped to municipio boundaries.
import geoquetzal as gq

vor = gq.voronoi_lugares_poblados(municipio="Antigua Guatemala")
vor.explore(
    tooltip=["nombre"],
    tooltip_kwds={"aliases": ["Lugar Poblado"]},
    tiles="CartoDB positron",
    style_kwds={"weight": 0.5, "color": "green", "fillOpacity": 0.3},
)
ℹ 2 lugares poblados excluidos por coordenadas nulas (códigos terminados en 999 — asentamientos sin nombre oficial).
✓ 57 polígonos Voronoi generadoslibrary(geoquetzal)
library(mapview)
vor <- voronoi_lugares_poblados(municipio = "Antigua Guatemala")
mapview(
vor,
map.types = "CartoDB.Positron",
color = "green",
alpha.regions = 0.3,
lwd = 0.5,
label = "nombre"
)Lugares poblados with NULL coordinates (codes ending in 999) are automatically excluded from the Voronoi. These are informal settlements without an official location.